Beautifying Org Plot with YASnippet and Context Menus
27 Jan 2023 Charles Choi
In using Org tables, it is a natural desire to visualize the data captured in them. Org Plot is a built-in feature in Org to do just that without having to leave Emacs. That said, a couple of caveats with using Org Plot out of the box:
-
Without configuration, Org Plot output is ugly.
-
Making Org Plot attractive requires a lot of boilerplate code with unmemorable syntax.
Given the above, it seems easier to punt and export your table data to a spreadsheet to make plots. But why bother with two sources of truth when you can just work with one? This post endeavors to show that you can have beautiful and easy to make plots with Org Plot.
Unconvinced? Come back after watching the video demo below.
Want to know more? Read on…
Background
Under the hood, Org Plot uses gnuplot to generate a graphic plot.
gnuplot is, like Emacs, a robust and highly configurable program. But like Emacs, gnuplot has many default settings that are less than desirable. The net result of this is that gnuplot without configuration produces ugly output. Don’t take my word for it - others say it here, here, here, and here.
That said, gnuplot can be easily configured to have attractive, daresay beautiful, output.
To generate a plot, the function org-plot/gnuplot is invoked via either the key binding C-c " g or calling M-x org-plot/gnuplot. When org-plot/gnuplot is first called, the gnuplot program is initialized and communicated to via the Emacs buffer ✷gnuplot✷. From there org-plot/gnuplot will translate the #+PLOT options for a table into gnuplot commands.
Org Plot Out of the Box
Here’s an example of a table taken from the Org Plot documentation.
1 2 3 4 5 6 7 8 | |
Running org-plot/gnuplot will result in a GUI window plot as shown below:
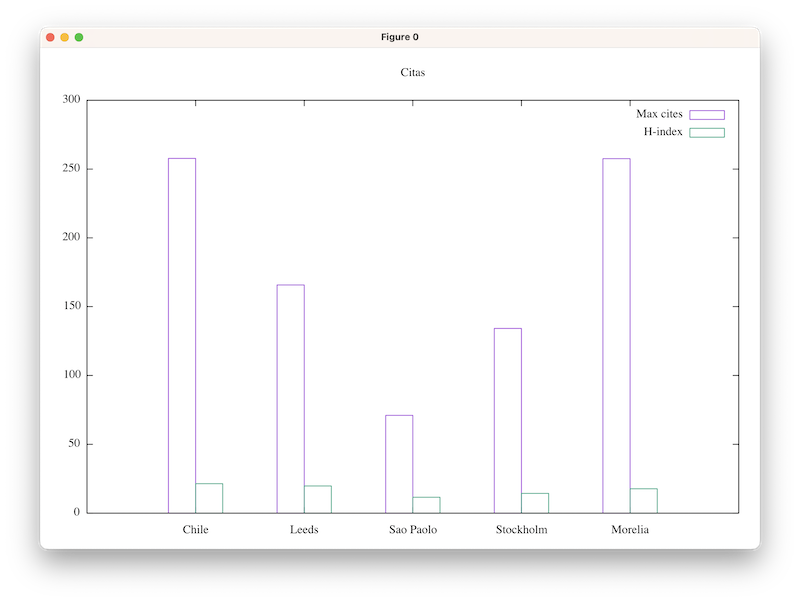
A couple of observations at this point:
-
All the
PLOToptions are put into a single line, but they don’t have to be.Options can be enumerated over multiple lines for easier comprehension and maintainability.
-
The key binding for
org-plot/gnuplotis quite difficult to remember.YMMV, but I'll likely never remember
C-c " g. -
The rendered plot is missing basic elements such as labels for the x and y axis.
There are also no affordances to change the typeface and size for different labels.
-
While the resultant plot is functional, thin lines and unfilled shapes is unattractive.
In the next section, we’ll show how to address these observations to get more attractive output from Org Plot.
Objectives
Let’s sanity check the things we want to achieve with this post:
- Support quick creation of plots from an Org table that you can use and share with colleagues without embarrassment.
- Support line and column (called histogram in gnuplot) style plots.
- Support configuring basic plot features:
- plot title
- x and y axis labels
- typeface and sizes of the above
- Use
context-menu-modeas the primary UI to Org Plot. - Not require associative recall of gnuplot commands and options to achieve the above.
Prerequisites
Beautifying Org Plot
Set the typeface, and typeface size
Org Plot provides a pass-through interface for the gnuplot command set, which is used to set a multitude of gnuplot options. The line below shows how the typeface and typeface size can be configured via the <typeface> and <typeface-size> parameters. Setting these values will apply to all labels used in the plot.
1 | |
For my taste, I’ll use Futura for <typeface> and 12pt for the <typeface-size>.
Alternately, one could configure the gnuplot terminal and set graphic device, size, and font in a single command. For example on macOS:
1 | |
Setting the <typeface> and <typeface-size> for the x and y axis labels are done via the gnuplot options xtics and ytics respectively.
1 2 | |
If <typeface> is omitted, then the current font option value will be used.
Set the histogram (column) style
We’ll configure the style of the histogram with the following code. Refer to the gnuplot documentation on histograms for more detail on syntax.
1 2 | |
Set the Legend
The gnuplot option key controls how the legend is rendered. Refer to the gnuplot documentation on key placement and key for more detail on syntax.
1 | |
Set the Axis Labels
The options xlabel and ylabel can be set with the appropriate string values for the plot at hand. Replace <xlabel> and <ylabel> accordingly.
1 2 | |
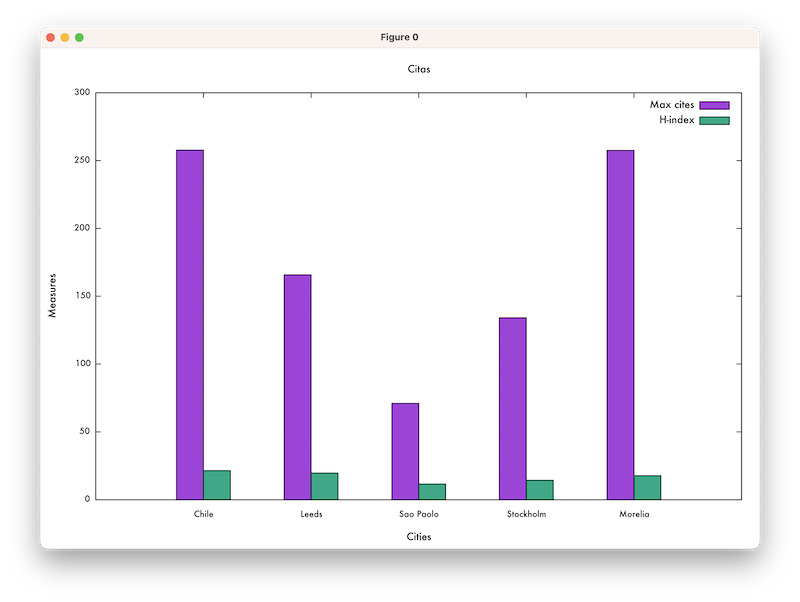
Bring it all together
The following code brings all of the above together. The output result from running org-plot/gnuplot is shown below.
1 2 3 4 5 6 7 8 9 10 11 12 13 14 15 16 17 18 19 20 | |
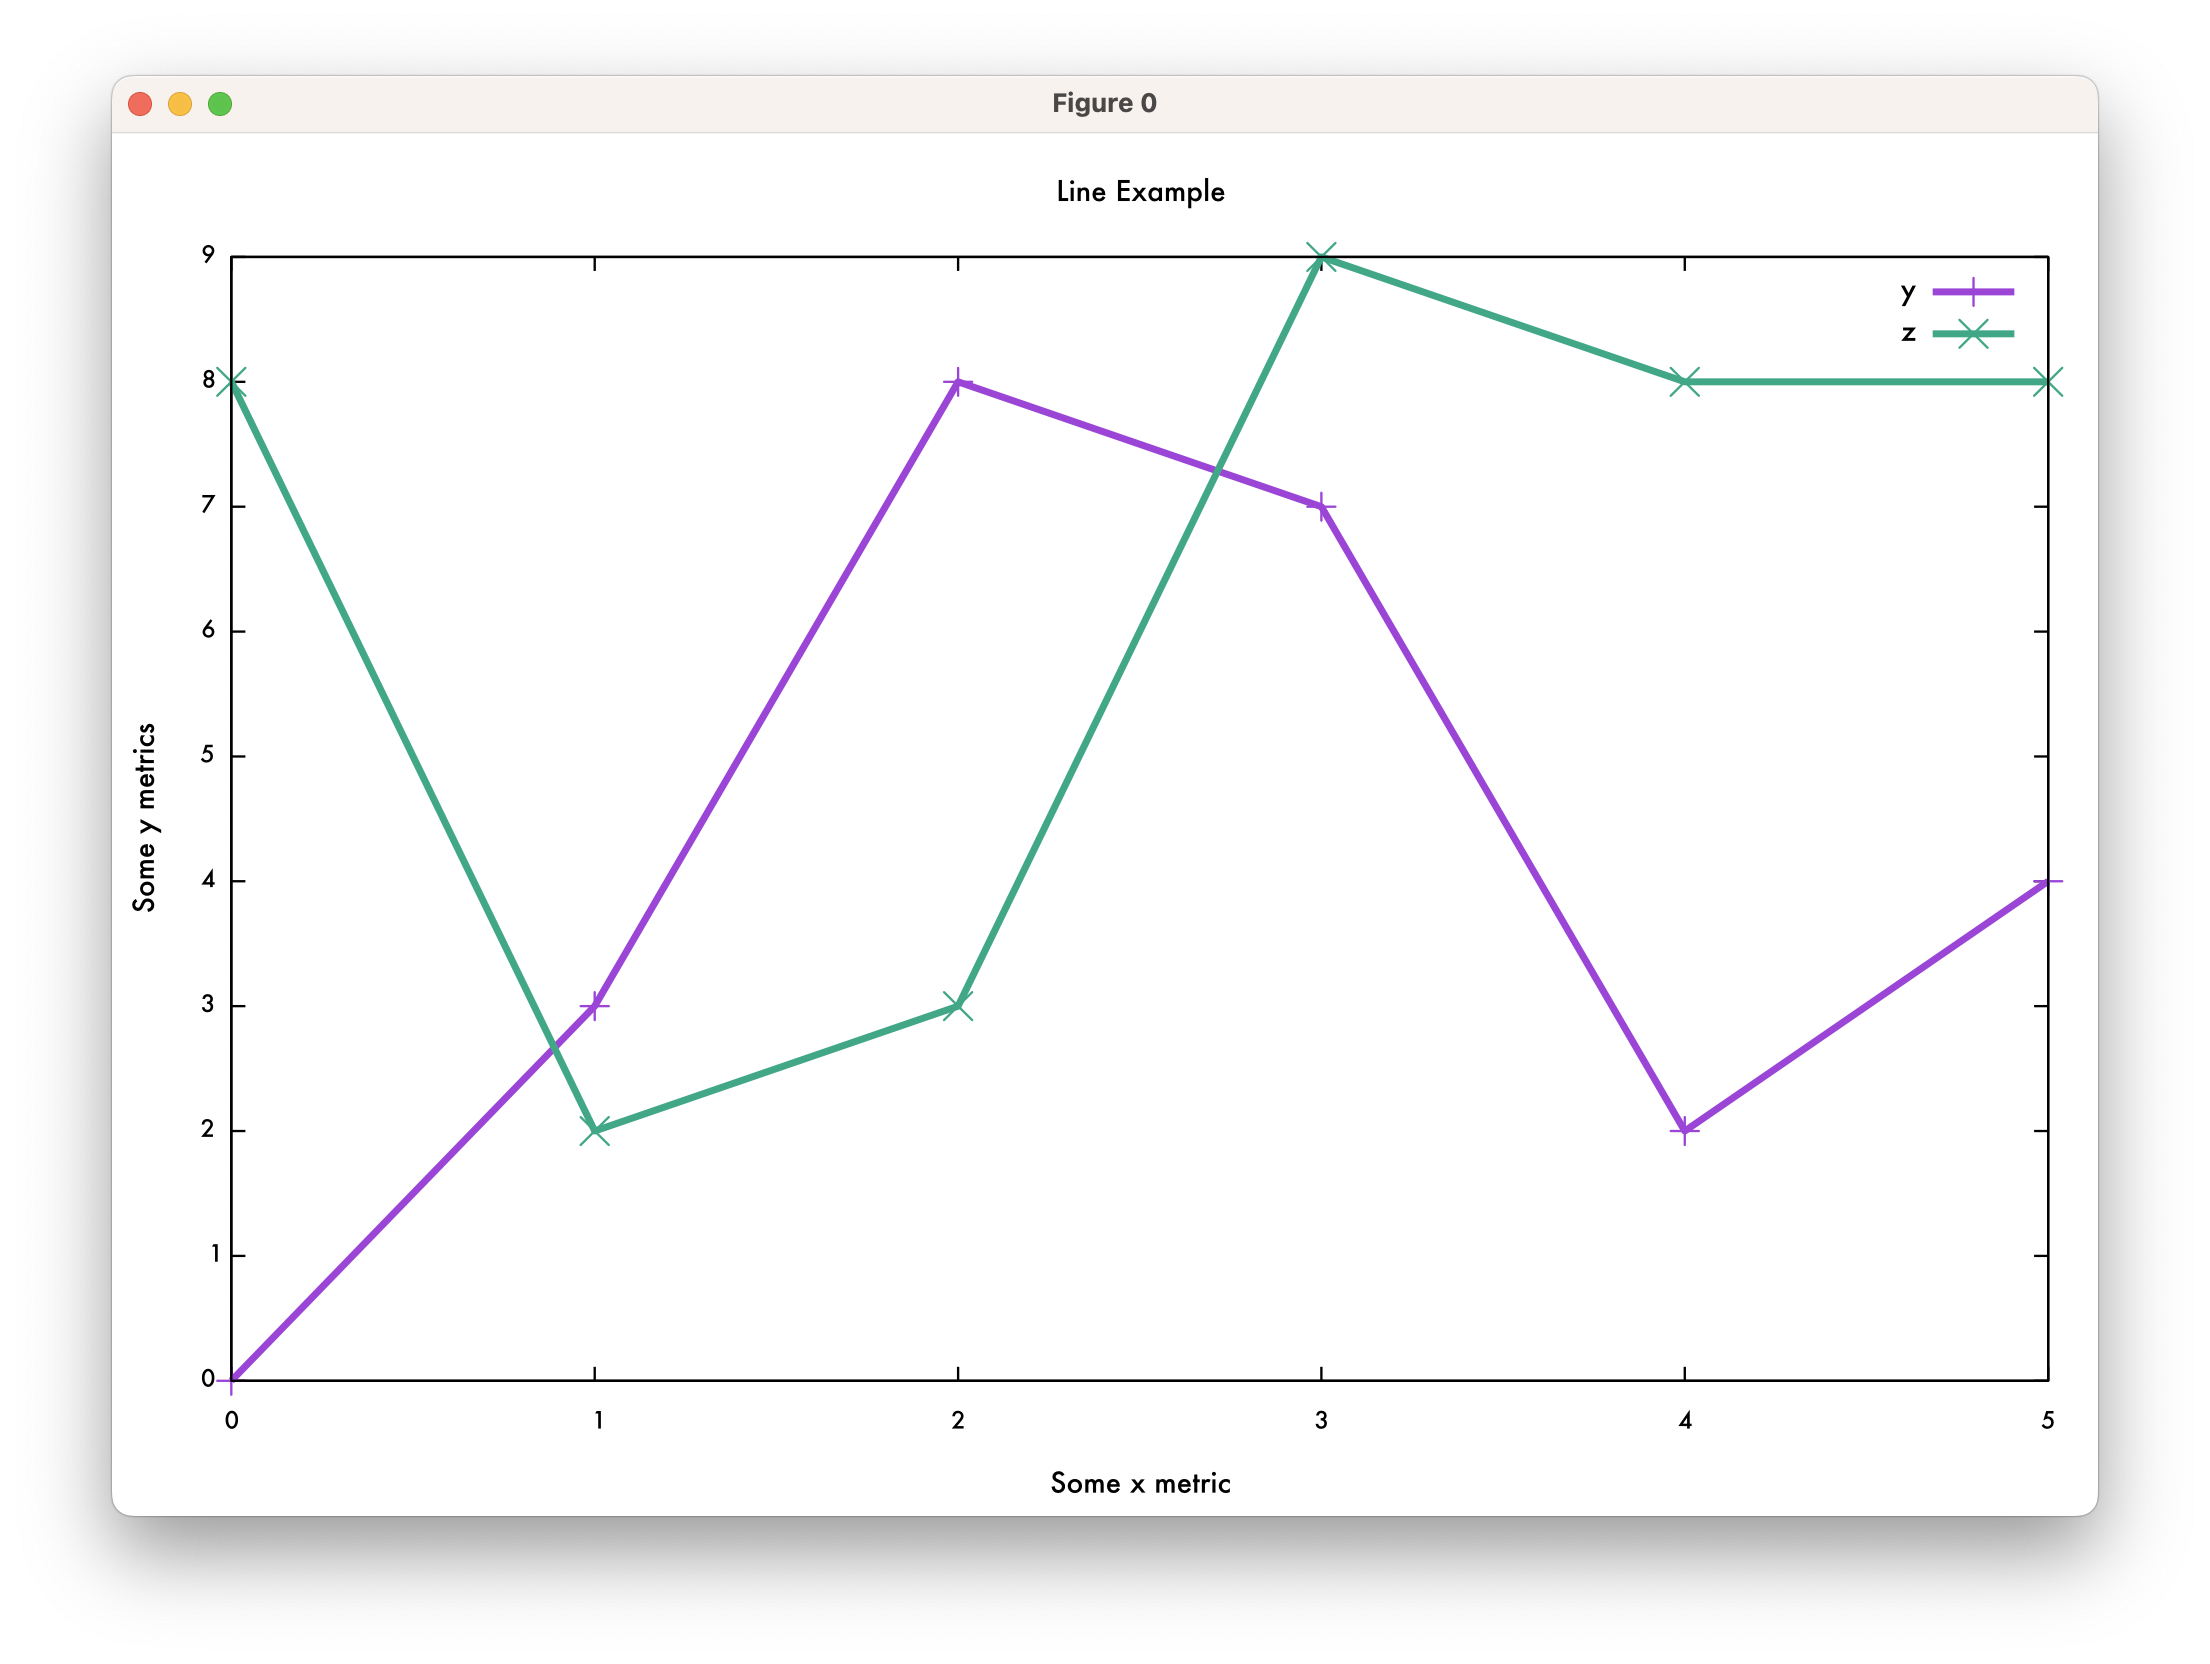
Line Plot Example
If the plot is using line style, you can specify the linewidth to use. Here it is specified the value of 3 px.
1 | |
Adjusting the PLOT header accordingly, the source and resultant plot output is shown below.
1 2 3 4 5 6 7 8 9 10 11 12 13 14 15 16 17 18 19 | |
So much boilerplate to type. Can we do something about that?
So at this point we have the desired control and aesthetics but at the cost of a lot of boilerplate PLOT statements. To alleviate typing, we'll use YASnippet, a template system that supports dynamic expansion. Among the key features it provides is the ability to prompt the user to choose different values and based on that value dynamically generate the expanded output.
For the histogram example above, the YASnippet template can be as follows:
1 2 3 4 5 6 7 8 9 10 11 12 13 14 15 16 | |
The above snippet has logic to 1) dynamically choose the terminal type (term), 2) tab key to different fields to populate the plot’s title, axis labels, and histogram style, and 3) define which table column is independent (ind) and which columns are dependent (deps).
Note that different YASnippet templates can be created for different plot types. For this post we’ll only concentrate on variants of lines and histograms.
1 2 3 4 5 6 7 8 9 10 11 12 13 14 | |
At this point we have some snippets but have yet to define a way to invoke them. I don’t intend to frequently make plots but for the times that I do I want it to be easy. Context menus (aka right mouse button menus) offer low cognitive load so let’s go with that.
Integrating Org Plot with Context Menu Mode
Introduced in Emacs 28, context-menu-mode provides built-in conventions for using and customizing right mouse button menus. For this post, I’ll just capture the Elisp that I used to integrate Org Plot into context menus. For further elaboration on how customizing context menus works, please read up my earlier post on it.
Here’s a screenshot showing my Org Plot context menu at work.
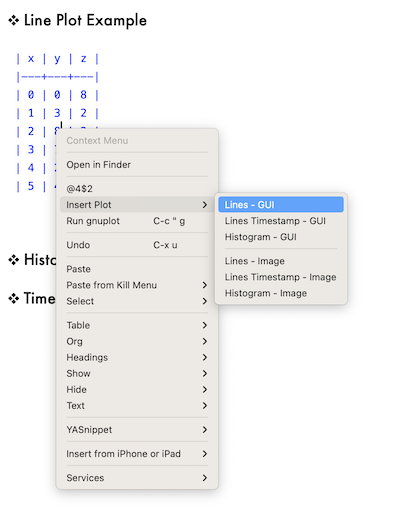
At the top level, the menu items are:
-
The cell reference the pointer is in
Selecting this item will put the cell reference (in this case the string
@4$2) into the kill ring. -
A sub-menu labeled
Insert Plot -
Run gnuplotwhich invokesorg-plot/gnuplot
Note that the Org Plot context menu is only shown if the pointer is within the bounds of a table.
Make the Keymap for Insert Plot sub-menu
The following code-snippet illustrates how the sub-menu for Insert Plot is implemented. The keymap variable cc/insert-org-plot-menu holds the menu-item instances, each of which holds a reference to the function that inserts the desired snippet.
1 2 3 4 5 6 7 8 9 10 11 12 13 14 15 16 17 18 19 20 21 22 23 24 25 26 27 28 | |
Attach the Insert Plot sub-menu to the Context Menu
The following code shows how to hook the above menu cc/insert-org-plot-menu into the top-level context menu via the function cc/context-menu-addons. The function cc/kill-org-table-reference is used to copy the table reference into the Emacs kill-ring.
1 2 3 4 5 6 7 8 9 10 11 12 13 14 15 16 17 18 19 20 21 22 23 24 25 26 27 28 29 | |
Functions to Insert Snippets
There is a general function cc/org-plot-insert-snippet which will insert an arbitrarily named snippet into the buffer at the start of an Org table. Its implementation checks to see if the pointer is within a table before inserting the snippet.
From there a number of helper functions invoking cc/org-plot-insert-snippet with a specific snippet name are defined. These helper functions are referenced by cc/insert-org-plot-menu above.
1 2 3 4 5 6 7 8 9 10 11 12 13 14 15 16 17 18 19 20 21 22 23 24 25 26 27 28 29 30 31 32 33 34 35 36 37 38 39 40 | |
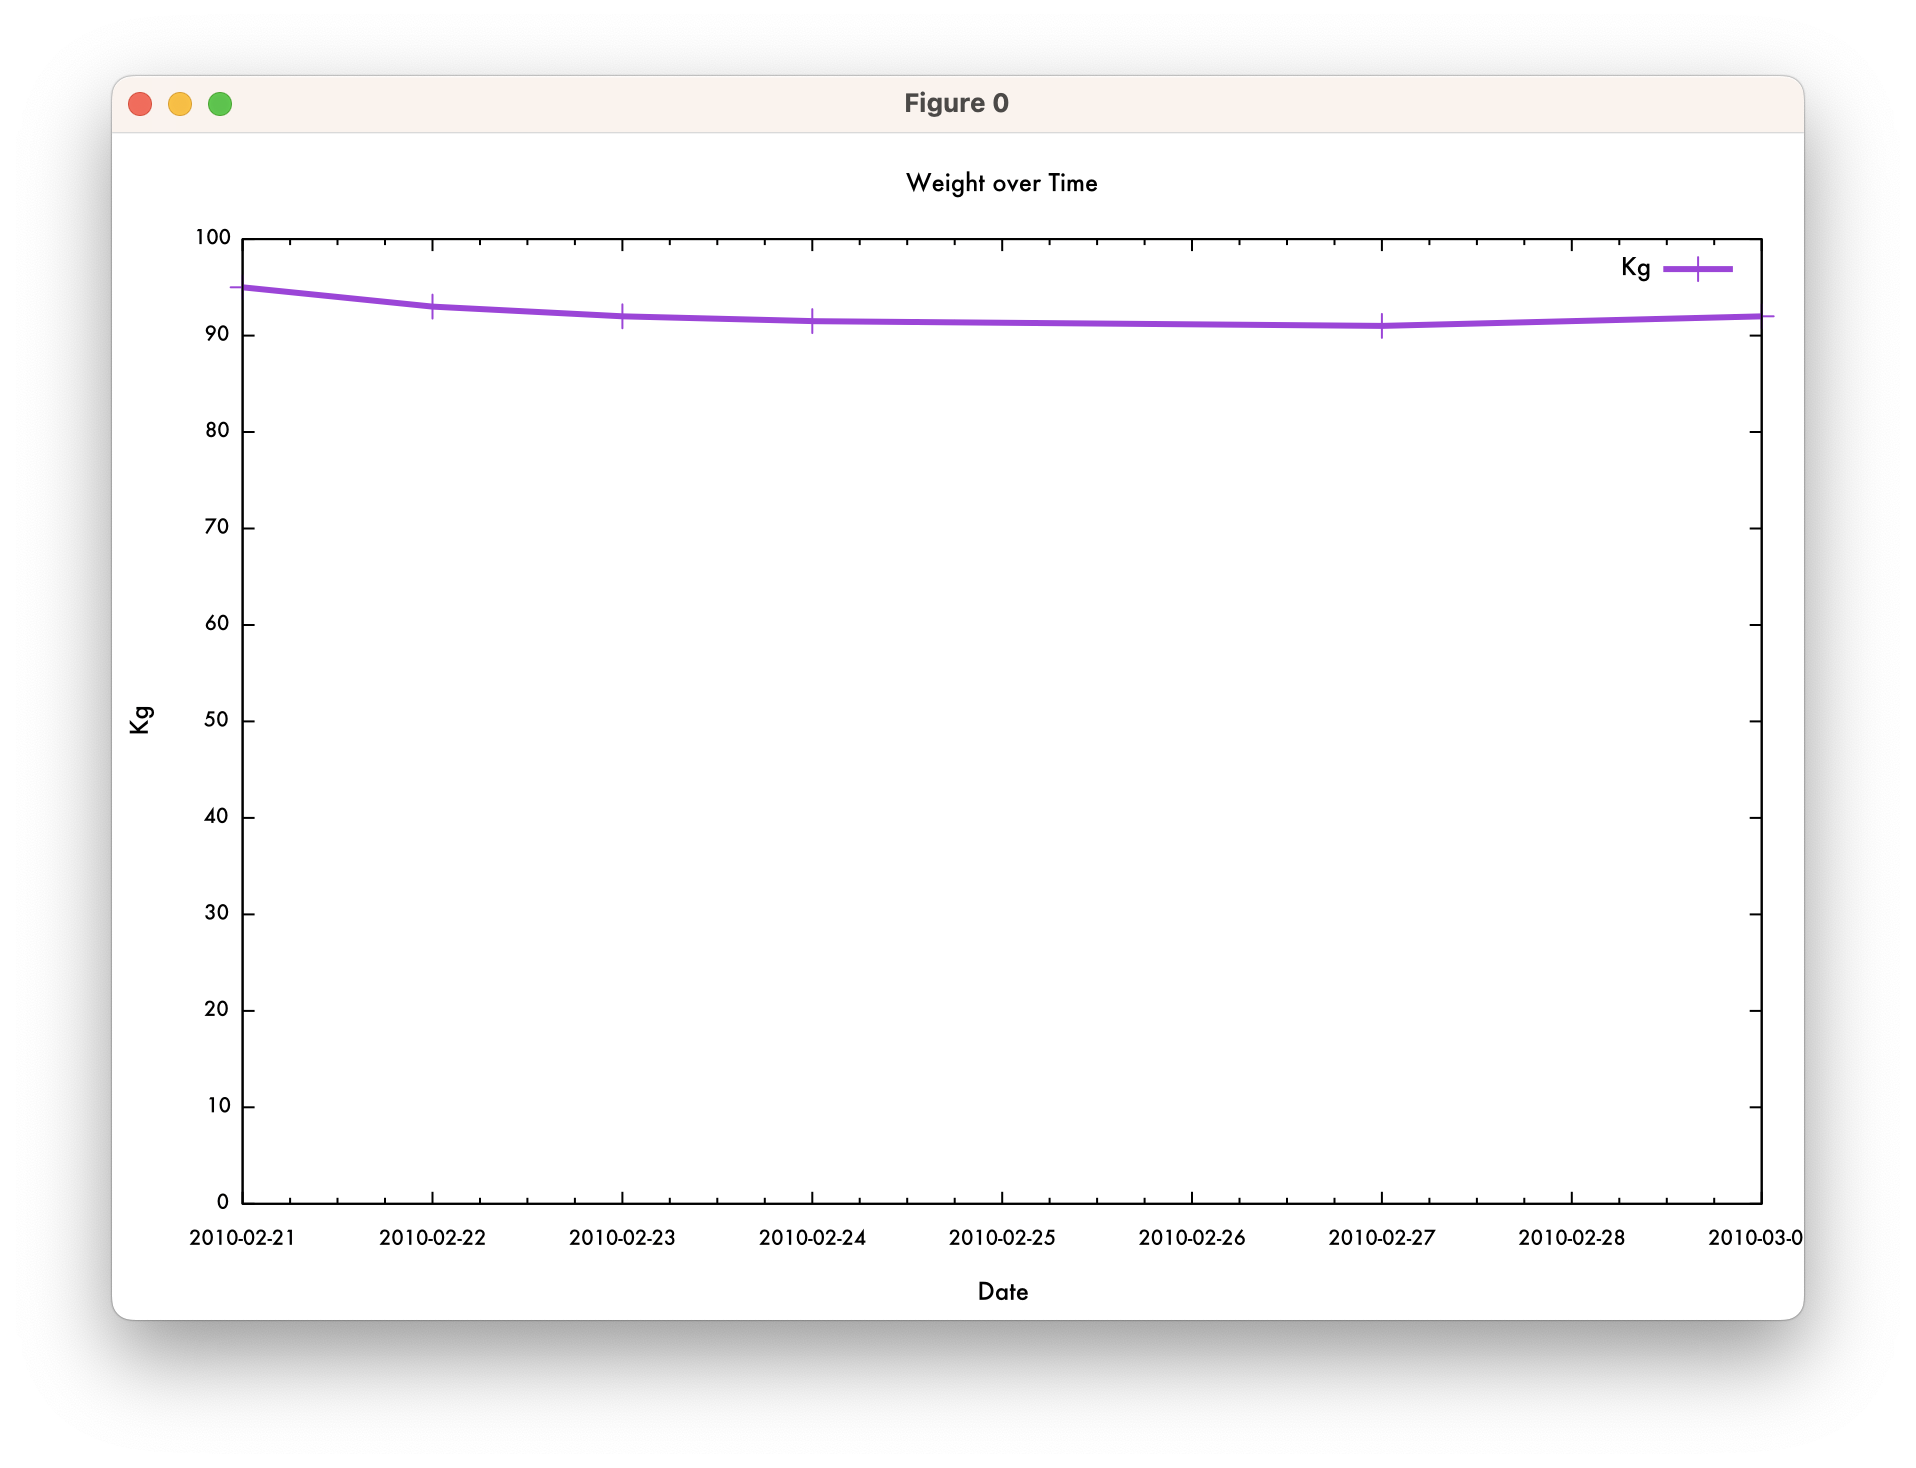
What about timestamps?
Org Plot has the ability to work with both Org-style and regular timestamps as the independent column. The snippet below shows how this is supported.
1 2 3 4 5 6 7 8 9 10 11 12 13 14 15 16 | |
Note that there is a current bug in Org Mode as of 9.6.1 that requires declaring the timeind option. For timestamps to work, timeind must be set to 1.
1 2 3 4 5 6 7 8 9 10 11 12 13 14 15 16 17 18 19 20 21 | |
Here’s the resultant plot:
Writing to SVG, JPEG, or PNG
The above snippets are configured to output to a gnuplot GUI terminal. The snippet below is tuned to write a file to either a SVG, JPEG, or PNG format.
1 2 3 4 5 6 7 8 9 10 11 12 13 14 15 16 17 | |
Concluding Thoughts
- Org Plot can be made much more attractive and usable with YASnippet and context menus.
- The code examples (particularly the snippets) above can be refined to be both more generalized and richer in capability.
- For Org Table users, one less reason to leave Emacs for a spreadsheet program. 😏
Acknowledgments
Thanks to yantar92Orgcontr on the #org-mode IRC channel for the assistance in identifying the issue with timeind.