Prototyping a Toolbar UI for Edebug
03 Nov 2025 Charles Choi
About a year and a half ago I delved into understanding Edebug ((elisp) Edebug), the built-in debugger for Emacs Lisp (Elisp), as I was to give a presentation on it at the Emacs SF meetup. For new users, Edebug can be bewildering as it forces them to know beforehand its many commands and respective keybindings to make good use of it. Because of this complexity, many users writing Elisp often favor simple print-style debugging to avoid ever dealing with Edebug.
My dive into Edebug however left me with the impression that it was more a “kit of parts” in need of a good UI. So I set about to build an Edebug UI with Transient menus. The result of that effort was decidedly mixed. More often than not, window/frame management by Edebug would conflict with Transient. I shelved it.
Working on the toolbar icons for Calle 24, the thought occurred: what about a toolbar for Edebug? The results I think are much more successful, with a number of caveats that I’ll get to later. As far as successes, here’s what I think this toolbar brings:
- Similarity to conventional IDE debuggers.
- Avoidance of Edebug window/frame management.
- Improved discovery of Edebug features.
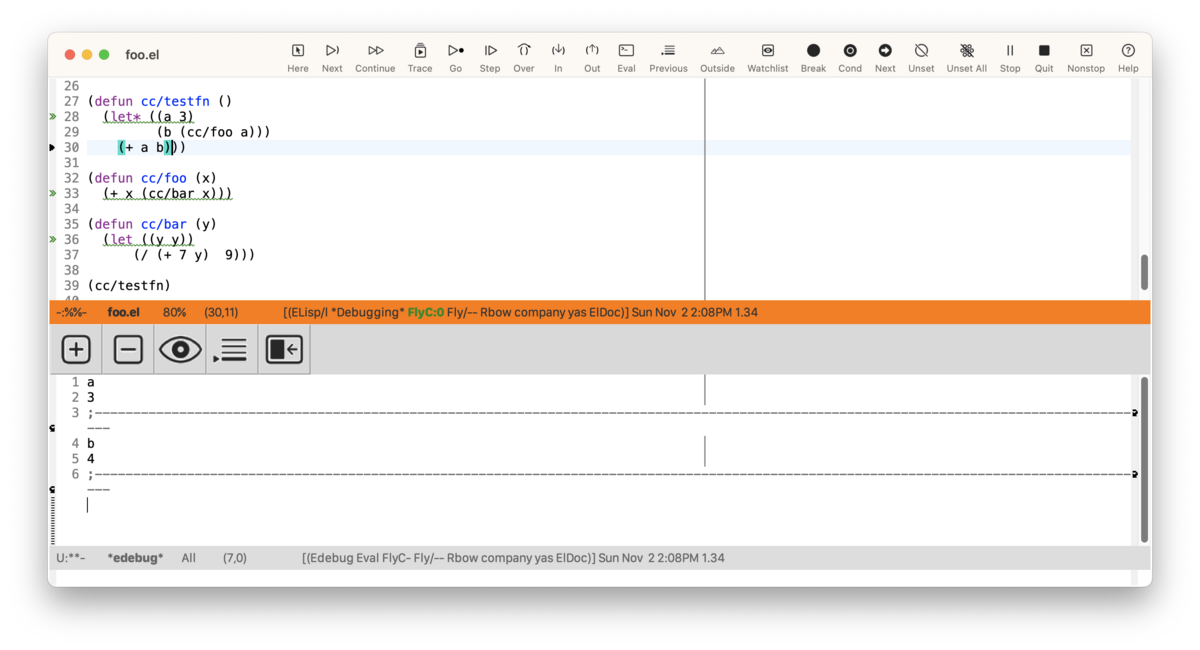
The screenshot below shows this toolbar in action:
Motivated readers are invited to try this toolbar out using the instructions described in Calle 24 Edebug Support. If you have a prior installation of Calle 24 installed, you should update and re-run the command calle24-install to synchronize with the latest icon set in the v1.1.1 update on MELPA.
Edebug differences from other IDE debuggers
Users new to Edebug but familiar with debuggers for ALGOL-like languages (C, Java, Python, Swift, etc.) should understand that stepping through Elisp code is sexp-based. This distinction is significant when considering stepping into and out of an sexp, which is not the same as a function in ALGOL-like languages. Also, breakpoints can only be set during an Edebug session. If the Edebug-instrumented function is re-evaluated using eval-defun, all prior breakpoints defined for it are lost.
Caveats
Despite my enthusiasm for this toolbar, this should be considered prototype code for the following reasons:
-
There is an existing bug in the NS variant of GNU Emacs 30.1 where repeated rapid pressing of a toolbar button can force Emacs into a state where it is not responsive to GUI input. Bug reports can be found at #76749, #72496.
-
Both NS and GTK variants can only show toolbar icons in a single row.
-
window-tool-bar-modedoes not support appearance changes (dark, light mode). -
The licensing of SF Symbols icons precludes their distribution using a GPLv3 license.
Closing Thoughts
In many ways, building this toolbar has been a “proof of concept” for me in answering the question: can Edebug have a better UI? I think the answer is a resounding yes, so much so that I’ve decided to put it out in public for others to scrutinize. By no means do I consider this “finished product” given the caveats described above. That said, for those folks who decide to give it a try I’d be interested to know your thoughts.